At SEACAMP in Jena on May 8, 2025, I gave a comprehensive presentation on SEA Reporting Dashboards. For those who couldn’t attend or would like to deepen their knowledge, I summarize here the most important content and detailed practical examples.
Why Professional Dashboards?
Agency dashboards create a unified communication standard, enable daily performance analysis, and significantly facilitate communication with clients. Individual filters, central data sources, and visually comprehensible presentation eliminate Excel chaos and strengthen the professional appearance.
Requirements for an Optimal Dashboard
A good dashboard should meet the following criteria:
- Consistency across clients
- Quick orientation for SEA managers
- Rapid creation and scalability
- Maintenance and operation by multiple people
- Controlled data scope and fast loading times
- Integration of specific business cases and own branding
Looker Studio for Fast, Flexible Dashboards
Looker Studio (formerly Data Studio) is Google’s free BI tool for data visualization. For SEA managers, it offers an uncomplicated way to create reports – especially in combination with Google data sources such as Google Ads, GA4, or BigQuery.
Advantages:
- Free: Ideal for agencies with many clients.
- Direct integration: Seamless access to GA4, Google Ads, Google Sheets, BigQuery, and more.
- Interactive: Users can flexibly choose time periods, filter with a click, and directly control data preparation.
- Visualization: Many different chart types, tables, bars, and metric tiles.
Disadvantages:
- Performance: With larger data volumes (e.g., >1 million rows), the dashboard becomes slow.
- Dependency on Google Account: Users absolutely need a Google login for usage and viewing.
- Limited combinability: Not all data fields can be combined arbitrarily.
- Ad-hoc connections: Data retrieval can be slow or unstable for non-pre-aggregated sources.
- No own storage: The data is not stored in Looker Studio itself, but in the linked sources – which can lead to latencies.
Looker Studio is ideal for simple, quick dashboards with Google connections. For larger setups, combining it with BigQuery as a preliminary data basis and structured pre-processing via tools like Dataform is recommended.
- Looker Studio enables flexible, free dashboards with:
- Time period selection
- Direct filtering by clicking on values
- Diverse visualizations
- Direct integration of many sources (GA4, Google Ads, BigQuery, Google Sheets)
However, Looker Studio reaches its limits with larger data volumes and absolutely requires a Google account.
Scaling with Google BigQuery
Google BigQuery is the heart of a scalable agency dashboard. As a high-performance, cloud-based data warehouse, it is ideal for centrally managing large and complex data volumes.
Advantages:
- Scalability: Processing billions of rows at high speed.
- Central data storage: All client and campaign data in one place.
- SQL queries: Use of a powerful SQL dialect for individual analyses.
- Automation: In combination with tools like Dataform and Terraform, data flows can be automated.
- Security rights management: Fine-grained access control via Google Cloud IAM.
Disadvantages:
- Costs: Billing based on query volume (potentially expensive with poor query optimization).
- Complexity: Higher entry barrier for teams without SQL or cloud experience.
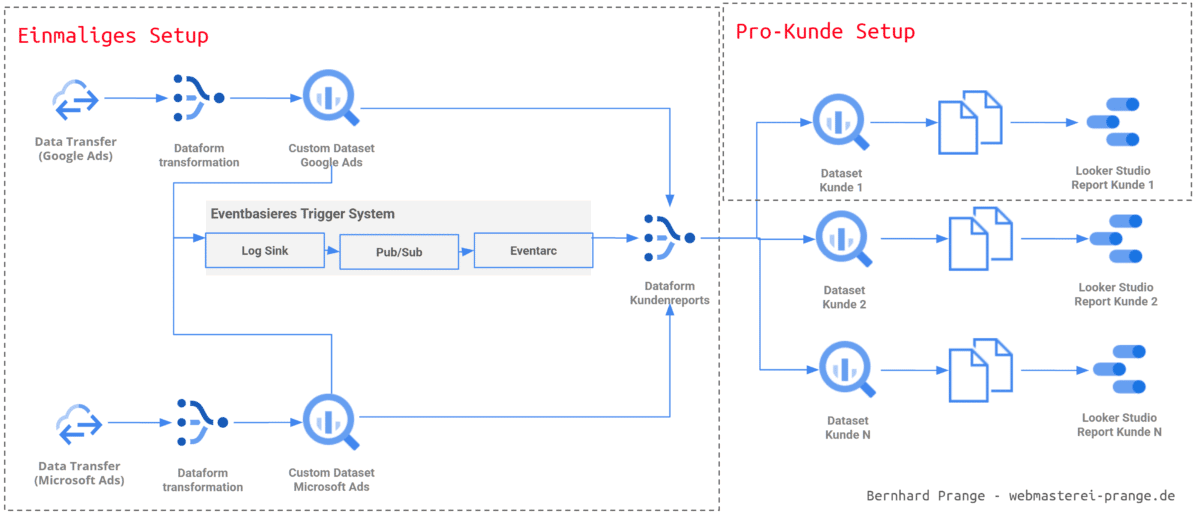
Example: Combined Agency Dashboard (scalable version)
The architecture of a scalable dashboard is based on the following structure:
- Data sources: Google Ads Microsoft Ads (all accounts each)
- Import: Via Data Transfer Services to Google BigQuery
- Structure: A separate dataset for each client
- Transformation: Data preparation via Dataform
- Visualization: Dashboards per client in Looker Studio

This setup allows for:
- Client-specific filters and visualizations
- Consistent structure and logic per dashboard
- Centralized maintenance and scaling for new clients
- Version control via SQL and Terraform projects
BigQuery makes it possible to represent both operational metrics (e.g., clicks, conversions) and strategic analyses (e.g., channel comparisons, long-term evaluations) on a unified data layer. Google BigQuery solves these problems and serves as a central data warehouse:
- Fast integration of diverse data sources
- Use of an SQL dialect
- Simple automation and reproducibility
BigQuery Data Transfer Service (DTS)
A central element for efficiently integrating marketing data into BigQuery is the BigQuery Data Transfer Service (DTS). This tool enables automatic and regular import of data from sources such as Google Ads or the Merchant Center.
Advantages:
- Automated data imports: No manual CSV export or API scripting needed
- Seamless integration with Google products: Data from Google Ads or Google Analytics can be integrated with just a few clicks
- Time-controlled processes: Daily or hourly data updates possible
- Combinable with third-party providers: External platforms can also be connected via connectors like Supermetrics or winsor.ai
Disadvantages:
- Outdated API versions: Some connectors don’t always use the latest API versions, which can lead to missing fields
- Limited control: The transfer process is less flexible than with a custom-developed API integration
- Cost factor for third-party connectors: Supermetrics Co. incur additional license fees
Example application:
DTS is particularly useful when creating agency dashboards to regularly provide Google Ads data for all clients in BigQuery. These datasets can then be further processed with Dataform and visualized through Looker Studio. This lays the foundation for scalable, automated reporting.
Google Ads Data Transfer Configuration
To activate the Google Ads Data Transfer in BigQuery, no custom API programming is necessary. Activation is done directly through the Google Cloud Console:
- Select BigQuery project – Ensure that the project has billing set up and BigQuery is activated.
- Access the Data Transfer Service – You can create a new transfer under Transfers in BigQuery.
- Select data source – For example, select “Google Ads” as the source.
- Link account – The Google Ads account must be authenticated via OAuth.
- Configure transfer – Set target dataset, update interval, and start date.
After setup, BigQuery automatically creates tabular data structures such as Customer, Campaign, AdGroup, Ad etc. These tables form the basis for further processing with SQL tools like Dataform. Note that not all metrics or assignments are included – for example, campaign or account names are often missing, requiring additional join logic (e.g., via customer_id and campaign_id).
Advanced Configuration Options in BigQuery Data Transfer Service
The BigQuery Data Transfer Service (DTS) offers additional configuration options to control the data import from Google Ads more precisely.
Table Filter: This option allows specific tables to be selected or excluded for import. By default, all available tables are imported. By specifying table names (e.g., Campaign, AdGroup) or prepending a minus sign for exclusion (e.g., -Campaign, AdGroup), the import can be precisely controlled. (Source: Google Cloud)
Refresh Window: This window determines how many days of data are updated retroactively with each transfer. By default, the refresh window is 7 days but can be extended up to 30 days. This is particularly useful for capturing delayed data updates or closing data gaps. (Sources: Stack Overflow, Supermetrics Support)
Custom Reports: For specific analysis needs, custom reports can be created using Google Ads Query Language (GAQL). For each custom report, a GAQL query is defined that specifies the desired fields and resources. It’s important to note that certain GAQL clauses such as WHERE, ORDER BY, LIMIT, and PARAMETERS are not supported in the context of DTS. Additionally, a condition WHERE segments.date = run_date is automatically added when a date segment is included in the query. (Sources: Google Cloud, Swipe Insight, Stack Overflow)
By using these advanced configuration options, data imports from Google Ads can be made more efficient and targeted, improving the quality and relevance of data available in BigQuery.
Automating Data Transfer with Dataform
Dataform is an open-source tool from Google specifically developed for orchestrating SQL-based transformations in data warehouses like BigQuery. It allows teams to organize SQL code in a structured manner, develop modularly, and version control through Git. Dataform is particularly powerful in projects where many recurring transformations need to be executed consistently and reproducibly.
Advantages of Dataform:
- SQL-first: No additional programming language necessary – all transformations are based on SQL.
- Incremental Processing: Tables can be efficiently updated without complete recalculations.
- Dependency Management: Dataform automatically recognizes the order in which tables need to be created.
- Automation: Jobs can be automatically executed via schedules or triggers.
- Git Integration: Changes to the code are traceable, testable, and team-friendly.
Concrete Use in Dashboard Projects:
In SEA dashboards, Dataform is used to process the raw data imported from the BigQuery Data Transfer Service:
- Transformation of raw tables into usable models (e.g., campaign report, daily metrics, channel summaries)
- Joining tables to add missing fields such as campaign or account names
- Calculation of custom KPIs, such as cost/revenue ratios or TV attributions
- Provision of final reporting tables as a source for Looker Studio
Example Dataform SQL Definition:
config {
type: table,
schema: reporting,
name: daily_campaign_performance,
tags: [google_ads]
}
SELECT
campaign_id,
customer_id,
DATE AS report_date,
clicks,
impressions,
cost_micros / 1e6 AS cost_eur
FROM
raw_google_ads_campaign_stats
WHERE
DATE = CURRENT_DATE() - INTERVAL 30 DAY;
Dashboard Creation in Minutes with Looker Studio Dashboard Cloner
The Looker Studio Dashboard Cloner (lsd-cloner) is an open-source tool from Google that enables efficient duplication of Looker Studio dashboards. It uses the Looker Studio Linking API to copy dashboards including their data sources while making specific adjustments.
Functions and Applications
- Interactive Configuration: lsd-cloner guides the user through a series of questions to define the desired adjustments for the dashboard to be cloned.
- Automated Link Creation: Based on the inputs, the tool generates a link that, when opened, copies the dashboard with the specified settings.
- Adjustment of Data Sources: It allows remapping of data sources so that the cloned dashboard refers to other BigQuery tables or views.
- Template-based Work: By using JSON configuration files, recurring cloning processes can be standardized and automated.
- Batch Processing: Multiple dashboards can be generated in series – ideal for a larger number of clients.
- CLI-based: Runs on the command line, easily integrable into CI/CD processes.
Example Application
A typical scenario is the creation of customer-specific dashboards based on a central template. By adjusting the data sources and other specific parameters, customized dashboards for different clients or projects can be created quickly and consistently.
Example JSON Configuration
{
  project_id: webmasterei-reports,
  dashboard_id: 456789-d764-4847-ba1a-99d8153a8793,
  dashboard_name: {company name} Ads Dashboard,
  dashboard_dataset: report_companyname,
  dashboard_datasources: {
  campaigns: campaigns
  }
}
Command Line Command for Use
npm install -g lsd-cloner
lsd-cloner --answers=lookerstudio-ecommerce.json
This approach enables efficient scaling of reporting dashboards and ensures that all dashboards remain up-to-date and consistent with current data sources.
Note: lsd-cloner is an unofficial tool and is not officially supported by Google. It is advisable to conduct appropriate tests before using it in productive environments.
GitHub Link: https://github.com/google/looker-studio-dashboard-cloner
Terraform is an open-source infrastructure management tool by HashiCorp that allows cloud resources to be managed declaratively through code. Unlike manual configuration via user interfaces, Terraform enables the definition of the entire infrastructure in configuration files – which greatly simplifies maintenance, repeatability, and scaling.
Complex Structure of Google Cloud
The image illustrates how complex the setup in Google Cloud can be to achieve the desired configuration. This makes the setup prone to errors and difficult to understand. Terraform offers a solution here.

Infrastructure Management with Terraform
Terraform is an open-source infrastructure management tool by HashiCorp that allows cloud resources to be managed declaratively through code. Unlike manual configuration via user interfaces, Terraform enables the definition of the entire infrastructure in configuration files – which greatly simplifies maintenance, repeatability, and scaling.
Application in the Google Cloud Context
In conjunction with the Google Cloud Platform (GCP), Terraform uses so-called providers to automatically provision resources such as BigQuery datasets, IAM roles, service accounts, transfer jobs, or Looker Studio integrations.
Advantages:
- Automation: Setup and changes are made via
terraform apply, reducing sources of error. - Versioning: All configurations can be versioned and tracked in Git.
- Modularity: Infrastructure can be structured into reusable modules (e.g., one module per customer).
- Consistency: All customer instances are based on the same defined structure.
- Scalability: New customers can be configured with a single command – with defined data source, location, time zone, and dashboard ID.
Terraform Example Configuration:
This example configuration demonstrates how to use Terraform to automatically create central Google Cloud resources for a Search Console dashboard project. The focus is on activating the BigQuery service and granting permissions to a service account that, for example, should import data from Google Search Console. All settings are defined as code and can therefore be versioned, documented, and automatically deployed.
variable project_id {
description = The ID of your Google Cloud project
type = string
}
variable region {
description = Data location / Execution location
type = string
default = europe-west-3
}
provider google-beta {
project = var.project_id
region = var.region
}
resource google_project_service bigquery
project = var.project_id
service=bigquery.googleapis.com
disable_on_destroy = false
}
resource google_project_iam_member search_console_job_user {
project = var.project_id
role = roles/bigquery.jobUser
member = serviceAccount:[email protected]
}
resource google_project_iam_member search_console_data_editor {
project = var.project_id
role = roles/bigquery.dataEditor
member = serviceAccount:[email protected]
}
Terraform Commands Overview:
terraform apply -var-file='my-var-file.tfvars' -auto-approve // Applies the configuration (without prompting)

terraform plan // Shows planned changes

terraform destroy // Deletes all managed resources

terraform workspace new myproject // Creates a new workspace named myproject

terraform workspace select // Switches between existing workspaces
Example: Automatically Creating a Customer Dashboard
This example shows how to automatically deploy a complete customer dashboard in Google Cloud using Terraform. Configuration is done via a separate.tfvars A file in which all customer-specific parameters are maintained centrally. This allows new customers to be provided with consistent data structures and dashboards within minutes – without any manual clicks in the Google Cloud Console.
The terraform.tfvars file contains, among others, the following parameters:
{

  customer_name = haarersatz24 // Unique name or abbreviation of the customer

  gitCommitish = 9264d79b859fa091235cd2c58b4c14a9462b79b28 // Dataform transform version

  defaultDatabase = my_project_name // Target dataset in BigQuery

  defaultLocation = europe-west3 // Region of the dataset (e.g. Frankfurt)

  timezone = Europe/Berlin // Time zone for time-based evaluations

  lookback = 30 // Lookback period in days for data retrieval

  dashboard_id = 12398123-asdkjfb1239-1234bj-askjib // Reference to a Looker Studio template

}
With this setup, terraform apply automatically creates all relevant cloud resources for the customer:
- a BigQuery dataset with the correct location
- appropriate permissions
- Dataform jobs for data transformation
- link to the dashboard template in Looker Studio
Through this automation, you can not only save time but also significantly increase the consistency and maintainability of your SEA dashboards. The configuration is versionable, verifiable, and can be integrated into CI/CD processes.
The Path to the Customer Dashboard
- Create Google Cloud Setup: The necessary resources such as BigQuery dataset, service accounts, and IAM roles are defined and deployed with Terraform.
- Create Dashboard Template: A generic dashboard with placeholder data sources is designed in Looker Studio, which will be cloned later.
- Create Customer-Specific Configuration: Using
.tfvarsfiles, the target structure is defined for each customer (e.g., dataset name, time zone, dashboard ID). - Automatically Create Dashboards: Using the Looker Studio Cloner (lsd-cloner), an individual dashboard is generated for each customer from the template.
- Deliver Explain Dashboard: The dashboards are handed over to customers, explained, and integrated into ongoing support.
- Optimize Expand: Regular adaptation of the dashboards to new KPIs, data sources, or business models keeps the reports current and useful.
Further Links for Detailed Instructions
This article summarizes all central aspects of the presentation at SEACAMP 2025 and provides a practical guide for building scalable SEA dashboards with Google and Microsoft data. From the basics of dashboards to integration with Looker Studio, BigQuery, and Dataform, all the way to automated infrastructure management with Terraform, it explains step by step how to implement a professional reporting architecture. Tools like the Looker Studio Dashboard Cloner (lsd-cloner) are also explained in a practical manner and placed within a complete setup process. The article is supplemented with further links and instructions for Google Search Console, Matomo integration, as well as tips for automation. Thus, this contribution offers a compact yet in-depth resource for SEA professionals who want to make reporting not only better but also more efficient.